Abstract
The aim of this study was to establish a novel approach to in vitro dissolution evaluation using a combination of the paddle method and a dialysis membrane, both to predict the overall in vivo performance of tacrolimus microspheres and also to identify a suitable dissolution test method to describe the in vivo initial burst phenomenon. This new dissolution method for evaluating the release of tacrolimus from microspheres consisted of rotating a customized paddle inside a dialysis membrane using a conventional paddle apparatus. Findings were compared with a method in which the paddle was rotated outside the dialysis membrane, the conventional paddle method, and the flow-through cell method. We concluded that the paddle method with a dialysis membrane and internal agitation, which was designed to mimic in vivo conditions, predicted the overall pharmacokinetic (PK) profile of tacrolimus microspheres whereas the conventional paddle method described the initial burst. These findings suggest that it may not be possible to predict both the PK profile and initial burst using a single analysis method. We therefore recommend that evaluation of the initial burst be performed separately. In conclusion, we propose that combination of the paddle method with a dialysis membrane and internal agitation to evaluate the overall PK profile, together with the paddle method to describe the in vivo initial burst, represents a novel approach to in vitro dissolution evaluation for microsphere formulations.
Introduction
Polyesters such as poly lactic acid (PLA) and poly(lactic-co-glycolic acid) (PLGA) have been used in medical resorbable sutures for the past 40 years.1) PLA and PLGA are biocompatible and biodegradable materials,2) and are therefore safe and secure for use as pharmaceutical bases for microspheres. To date, a number of microsphere products administered subcutaneously or intramuscularly have been launched globally, including Leuplin® depot and Zoladex®, and have greatly contributed to drug therapy.3) It is widely known that changing the characteristics of PLA and PLGA, such as the molecular weight, PLA/PGA ratio, and particle size, can change the release rate of an active pharmaceutical ingredient (API) from microspheres.4) Additional advantages of microspheres include their ability to encapsulate a variety of drugs, high bioavailability, and sustained API release for periods of several weeks or more, and the release of APIs from microspheres is now under active investigation.5)
Tacrolimus is an immunosuppression drug that inhibits calcineurin by forming a complex formation with FK506-binding protein.6) A tacrolimus-loading drug product was first launched onto the market as immediate release capsules and subsequently as an injection and extended release capsules. However, oral administration can cause glucose intolerance, one of the adverse effects of tacrolimus, depending on the resultant maximum blood concentration (Cmax) of the drug.7,8) Additionally, adherence to tacrolimus oral formulations in renal transplant patients is only 72 to 82%,9) indicating the risk of ineffective drug therapy. To improve the safety and efficacy of tacrolimus, microsphere technology can be used to develop a pharmacokinetic (PK) profile in which the Cmax is reduced and blood concentration at the steady state is within the therapeutic range.
Tacrolimus-loaded microspheres therefore represent a useful therapeutic option for these cases. Before use, however, the release properties of microspheres must be precisely characterized, preferably by an in vitro test method that can also evaluate in vivo performance. To date, however, no country has yet issued guidance or guidelines for the development, evaluation, and application of in vitro–in vivo correlation (IVIVC) for non-oral sustained release dosage forms. For extended release oral dosage forms, the Food and Drug Administration (FDA) issued guidance in 1997.10) According to that guidance, IVIVC can be categorized into four levels, namely A, B, C and multiple level C. In addition to these four levels, level D is defined as a rank order correlation comparing in vitro and in vivo release profiles.11) Few studies have reported level An IVIVCs, the highest IVIVC in the guidance.12,13) The IVIVC approach in the guidance is considered to be useful for design of microsphere formulations.
Microspheres are typically intended to provide the sustained release of drugs for periods of several weeks or more, such as in the cases of Leuplin® depot and Risperdal® Consta®.14) Because large amounts of drug must be loaded, evaluation of the initial burst requires care. However, methods for evaluating the initial burst, a phenomenon which is commonly seen with microspheres, are not well established. This is because most researchers have focused on IVIVC evaluation using correlation factors between the in vitro dissolution profile and deconvoluted in vivo absorption profile.12,15–17) Few researchers have focused on the impact of the initial burst because the dissolution rate at this time is usually much lower than that for the remaining compound. In addition, almost all previous studies on IVIVC evaluation were conducted using a single dissolution method, even though several dissolution methods have been used to evaluate API release from microspheres, including the sample and separate method,15,18,19) paddle method,20) flow-through cell method,16) and dialysis method.12,17)
Against this background, the objective of this study was to establish a novel in vitro dissolution evaluation approach using a combination of paddle method and dialysis membrane which can not only predict the overall in vivo performance of tacrolimus microsphere but also identify a suitable dissolution test method to describe the in vivo initial burst phenomenon. Microspheres administered subcutaneously or intramuscularly are retained at the administration site where they are surrounded by tissue layers which make slow drug diffusion due to non-sink conditions.21,22) This indicates that the rate-limiting step of microsphere performance in vivo does not always correspond to drug release from microspheres. A dialysis membrane method can make two compartments of a donor part which is non-sink environment and an acceptor part which is sink environment through a membrane dialysis. Because the donor part corresponds with the administration site and the acceptor part corresponds with the circulated blood, a dialysis membrane method is expected to mimic in vivo conditions, and is therefore likely to show good IVIVC for microsphere formulations with long term release profiles. Furthermore, internal and/or external agitation in the method would be useful to adjust drug release rate from microspheres and membrane permeation rate of the drug. Janas et al. recently reported a novel dialysis membrane using a combination of paddle method and dialysis membrane with the aim of reflecting the high drug release rate from nanoparticle formulations,23) not IVIVC evaluation for microsphere formulations.
Here, we evaluated this novel combination method by comparing it with a method in which the paddle was rotated outside the dialysis membrane, the conventional paddle method, and the flow-through cell (FTC) method.
Experimental
MaterialsPLGA and PLA (RG752H and R202H) were purchased from Evonik Industries AG (Essen, Germany). Polyvinyl alcohol (GOHSENOL™ EG-05) was obtained from The Nippon Synthetic Chemistry Industry Co., Ltd. (Osaka, Japan). Float-A-Lyzer® G2 (cellulose ester membrane, molecular weight cut-off [MWCO]: 1000 kDa) was purchased from Spectrum Laboratories, Inc. (CA, U.S.A.). Sodium lauryl sulfate (SLS) was purchased from Merck KGaA Inc. (Darmstadt, Germany). G4 filter, which is a customized item, was purchased from Nikko Shokai (Osaka, Japan).
All reagents were obtained commercially as analytical-grade reagents.
Preparation of Tacrolimus-Loaded MicrospheresPLGA and PLA microspheres were prepared according to an established method.24) Briefly, 215 mg of tacrolimus and a 500-mg mixture of PLGA and PGA were dissolved in 20 mL of dichloromethane. This solution was slowly added to 300 mL of 0.5% (w/v) polyvinyl alcohol aqueous solution with agitation at 1000 rpm overnight after which the solution was centrifuged at 1870 × g for 10 min. The precipitate was then dispersed in distilled water. The aqueous dispersion was filtered and the resulting residue was freeze-dried.
Characterization of Tacrolimus-Loaded MicrospheresHPLC ConditionsAn HPLC (2695 Separation module, Waters Co., MA, U.S.A.) with a C8 column (4.6 mm × 150 mm, 5 µm) at 50°C was employed. The mobile phase was a mixture of acetonitrile–water–methanol–6% phosphoric acid = 460 : 360 : 180 : 1 (volume ratio), and the flow rate was adjusted so that tacrolimus was eluted at ca. 14 min. Tacrolimus was detected at a wavelength of 210 nm.
Drug ContentTacrolimus-loaded microspheres (10 mg) and 10 mL of acetonitrile were combined in a 15-mL tube and the mixture was sonicated and shaken to completely dissolve the microspheres. An 80 µL volume of the solution was analyzed by HPLC.
The drug-loading ratio was determined as follows:
Particle SizeThe particle diameter of tacrolimus-loaded microspheres was measured using a particle size distribution analyzer (LA-950, Horiba, Ltd., Kyoto, Japan). The samples were dispersed in distilled water and sonicated before measurement.
Thermal AnalysisThe glass transition temperature (Tg) of the microspheres was determined using differential scanning calorimetry (DSC 2000, TA Instruments Inc., DE, U.S.A.). PLGA microspheres (2 to 4 mg) were scanned from −10 to 180°C at a rate of 5°C/min.
Permeability of Tacrolimus via Dialysis MembranePaddle Method with Dialysis Membrane and External AgitationAn NTR-6100A dissolution tester (TOYAMA SANGYO CO., LTD., Osaka, Japan) was used to evaluate the permeation rate (Fig. 1). Tacrolimus solution (5 mL) was transferred into a pre-washed dialysis membrane. The dialysis membrane was floated in a vessel containing 900 mL of Dulbecco’s phosphate-buffered saline, pH 7.4 (DPBS) with 0.5% SLS and the study was started by rotating a paddle outside the dialysis membrane at 50 rpm at 37°C. At the designated sampling points (1, 2, 4, 6, 8, 10, and 24 h), 2.5 mL of the elution outside the dialysis membrane was extracted using a volumetric pipet and 2.5 mL of dissolution medium was immediately added to replace the extracted sample. The elution was diluted with acetonitrile and the solution was analyzed using HPLC.
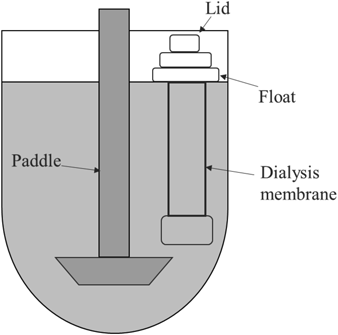
Paddle Method with Dialysis Membrane and Internal AgitationA DT-810 dissolution tester (JASCO Cooperation, Tokyo, Japan) and a customized paddle were used to evaluate the permeation rate (Fig. 2). Tacrolimus solution (2.5 mL) was transferred into a pre-washed dialysis membrane. The dialysis membrane was placed in a vessel containing 500 mL of DPBS with 0.5% SLS and the study was started by rotating the paddle inside the dialysis membrane at 75 or 150 rpm at 37°C. At the designated sampling points (1, 2, 4, 6, 8, 10, and 24 h), 2.5 mL of the elution outside the dialysis membrane was extracted using a volumetric pipet and 2.5 mL of dissolution medium was immediately added to replace the extracted sample. The elution was diluted with acetonitrile and the solution was analyzed using HPLC.
In Vitro Release StudiesSolubility of TacrolimusTacrolimus (10 mg) was added to 50-mL tubes containing 20 mL of dissolution media such as DPBS, without or with 0.1, 0.3, or 0.5% SLS. The solutions were sonicated for about 70 min. The tubes were placed in a shaking water bath (Lt-10F, TITEC CORPORATION, Nagoya, Japan) with the water temperature maintained at 37°C and shaken horizontally for 48 h. After shaking, 5 mL of the elution was extracted using a glass tube with a G4 filter. The filtrate was diluted with the dissolution medium and acetonitrile, analyzed using HPLC, and the solubility of tacrolimus in each dissolution medium was calculated.
Paddle Method without Dialysis MembraneAn NTR-6100 A dissolution tester (TOYAMA SANGYO CO., LTD.) was used for the in vitro release study. Tacrolimus-loaded microspheres (18 mg) were transferred to a vessel containing 900 mL of DPBS with 0.1% SLS. The release study was started by rotating the paddle at 50 rpm at 37°C. At the designated sampling points (1, 3, and 6 h, and 1, 3, 7, 14, 21, and 28 d), 10 mL of the elution was extracted using a glass tube with a G4 filter and 10 mL of dissolution medium was immediately added to replace the extracted sample. The filtrate was diluted with acetonitrile and analyzed using HPLC.
Paddle Method with Dialysis Membrane and External AgitationAn NTR-6100 A dissolution tester (TOYAMA SANGYO CO., LTD.) was used for the release study (Fig. 1). Tacrolimus-loaded microspheres (18 mg) were transferred into a pre-washed dialysis membrane containing 5 mL of DPBS with 0.1% SLS. The dialysis membrane was floated in a vessel containing 900 mL of DPBS with 0.1% SLS, and the release study was started by rotating a paddle outside the dialysis membrane at 50 rpm at 37°C. At the designated sampling points (1, 3, and 6 h, and 1, 3, 7, 14, 21, and 28 d), 10 mL of the elution outside the dialysis membrane was extracted using a glass tube with a G4 filter, and 10 mL of dissolution medium was immediately added to replace the extracted sample. The other conditions were the same as those described in “Paddle Method without Dialysis Membrane.”
Paddle Method with Dialysis Membrane and Internal AgitationA DT-810 dissolution tester (JASCO Cooperation) and a customized paddle were used for the release study (Fig. 2). Tacrolimus-loaded microspheres (10 mg) were transferred into a pre-washed dialysis membrane containing 2.5 mL of DPBS with 0.1% SLS. The dialysis membrane was placed in a vessel containing 500 mL of DPBS with 0.1% SLS and the release study was started by rotating the paddle inside the dialysis membrane at 75 rpm at 37°C. At the designated sampling points (1, 3, and 6 h, and 1, 3, 7, 14, 21, and 28 d), 10 mL of the elution outside the dialysis membrane was extracted using a glass tube with a G4 filter and 10 mL of dissolution medium was immediately added to replace the extracted sample. The other conditions were the same as those described in “Paddle Method without Dialysis Membrane.”
FTC MethodA CE7 dissolution tester (Sotax, Aesch, Switzerland) with 22.6 mm diameter cells was used for the release study. A ruby bead (5 mm diameter) was placed at the bottom of each cell and 1 mm diameter glass beads and 10 mg of tacrolimus-loaded microspheres were added to the cells. A filter with a pore size of 2.7 µm was attached in the top of the cells. DPBS (500 mL) with 0.1% SLS was employed and the release study was started with a flow rate of 4 mL/min at 37°C. At the designated sampling points (1, 3, and 6 h, and 1, 3, 7, 14, 21, and 28 d), 5 mL of the elution was extracted using a volumetric pipet and 5 mL of dissolution medium was immediately added to replace the extracted sample. The other conditions were the same as those described in “Paddle Method without Dialysis Membrane.”
In Vivo PK StudiesAll animal experimental procedures were approved by the Institutional Animal Care and Use Committee of Astellas Pharma Inc. The experiments were performed at Shin Nippon Biomedical Laboratories, Ltd. (SNBL, Tokyo, Japan). Astellas Pharma Inc., Yaizu Pharmaceutical Research Center and SNBL Drug Safety Laboratories have been awarded Accreditation Status by the AAALAC International.
Tacrolimus-loaded microspheres were dispersed in an aqueous solution containing 0.5% (w/v) carboxymethyl cellulose sodium and 10% (w/v) sucrose. The samples were subcutaneously administered to rats (LEW/CrlCrlj, 11 weeks old; Charles River Laboratories Japan Inc., Yokohama, Japan) at a single dose of 7.5 mg/kg. A 0.4 mL volume of blood was collected from the jugular vein using a heparinized syringe before this single microsphere dose and at 1, 3, 6, and 24 h and 3, 7, 14, 21, 28, 35, 42, 49, 56, and 63 d after it. The blood samples obtained were stored frozen at −20°C or lower.
The blood concentration of tacrolimus was determined by mixing 0.1 mL of the blood sample with an internal standard (IS; ascomycin in 50% methanol solution, lot DSQ1353, FUJIFILM Wako Pure Chemical Corporation, Osaka, Japan), 1 mL of 10 mM ammonium acetate, and 5 mL of diethyl ether in a glass tube. The mixture was shaken at ca. 200 shakes/min with a stroke length of 50 mm for 10 min and centrifuged under 4°C (805 × g, 5 min). The diethyl ether phase was collected after freezing the lower aqueous phase and the diethyl ether was then evaporated by warming to 42°C. The resulting residue was dissolved in 0.1 mL of a mixture of 2 mM ammonium acetate aqueous solution and methanol containing 2 mM ammonium acetate and 0.1% formic acid (5 : 95, v/v) and analyzed using liquid chromatography-tandem mass spectrometry (LC-MS/MS).
The LC-MS/MS system consisted of an HPLC (Accela, Thermo Fisher Scientific Inc, Waltham, MA, U.S.A.) and a mass spectrometer (TSQ Vantage, Thermo Fisher Scientific Inc.). The analytical column was TSKgel ODS-100Z 5 µm (2.0 mm i.d. × 50 mm) (Tosoh Corporation, Tokyo, Japan). The mobile phase was a mixture of 2 mM ammonium acetate aqueous solution and methanol containing 2 mM ammonium acetate and 0.1% formic acid (5 : 95, v/v), injected at a flow rate of 0.2 mL/min. The injection volume was 1 µL and LC was performed at a column temperature of 40°C. Product ions at m/z 768.45 (tacrolimus) and m/z 756.40 (IS) produced from their parent ions at m/z 821.20 and 809.20, respectively, were detected under SRM mode with electrospray ionization (positive). The blood concentration of tacrolimus was calculated from the peak area ratio using Xcalibur software (Thermo Fisher Scientific Inc.). The lower limit of quantification under these conditions was a blood concentration of 0.1 ng/mL.
The PK parameters Tmax, Cmax and the area under the curve to the last sampling point (AUClast) in blood were estimated with non-compartmental analysis using Phoenix WinNonlin 7.0 (Pharsight, CA, U.S.A.). The input rate of entry of tacrolimus from the microspheres into the blood circulation in rats was estimated using Phoenix WinNonlin 7.0 (Pharsight). The PK data of tacrolimus after intravenous administration to rats was also obtained.
IVIVCThe data generated in the in vitro release studies and in vivo pharmacokinetic studies of the microspheres were used to evaluate the IVIVC using the Winnonlin IVIVC Toolkit (Pharsight). The fraction absorbed was determined from the blood concentration-time data by the deconvolution method using AUC. AUClast was calculated using the linear trapezoidal rule. The Weibull equation25) was fitted to the in vitro release data to obtain an apparent continuous fraction dissolution profile. The Levy plot26) was generated based on the following equation, and the Akaike Information Criterion (AIC)27) between predicted and observed values was calculated.
 | (1) |
where, Fabs: fraction absorbed in in vivo, Absscale: scaling factor of dissolution rate, Diss (Tvivo): function of estimated fraction dissolved with in vivo time scale, Tscale: scaling factor of time, Tscale × Tvivo: in vitro time scale (=Tvitro), Diss (Tscale × Tvivo): function of fraction dissolved with in vitro time scale, Fdiss: fraction dissolved in in vitro calculated from Diss (Tscale × Tvivo).
Results and Discussion
Characterization of Tacrolimus-Loaded MicrospheresTable 1 characterizes of two different formulations of tacrolimus-loaded microspheres, which are named as TAD10 and TAD21. Given that previous studies have shown that API release from microspheres is fastest when the PLA/PGA composition ratio is 50 : 50 and the release rate increases as the molecular weight of PLA/PGA is smaller,3,28,29) PLA/PGA composition ratios of 75 : 25 and 87.5 : 12.5 were used for TAD10 and TAD21, respectively, in this study so that release properties would differ. The drug-loading ratio, entrapment efficiency and median particle diameter were similar between TAD10 and TAD21, falling in the range of 26.6–26.7, 88.7–89.0%, and 16.3–18.2 µm, respectively. However, there was a slight difference in Tg between TAD10 (45.8°C) and TAD21 (48.7°C). The increase in Tg with increasing PLA ratio is consistent with findings from a previous report by Kojima et al.24)
Table 1. Characterization of Tacrolimus-Loaded Microspheres
| Name | Tacrolimus (mg) | RG752Ha) (mg) | R202Hb) (mg) | Drug-loading ratio (%) | Entrapment efficiency (%) | Median particle diameter (µm) | Glass transition temperature (°C) |
|---|
| TAD10 | 215 | 500 | 0 | 26.6 | 88.7 | 16.3 | 45.8 |
| TAD21 | 215 | 250 | 250 | 26.7 | 89.0 | 18.2 | 48.7 |
a) Weight average molecular weight is 13600 and PLA/PGA ratio is 75 : 25. b) Weight average molecular weight is 18800 and PLA/PGA ratio is 100 : 0.
The results of the permeability studies are shown in Fig. 3. Dialysis membranes with larger MWCO values produce faster permeation rates,30) as do those made of cellulose ester compared to other membrane materials.31) We used Float-A-Lyzer® G2, a cellulose ester membrane (MWCO: 1000 kDa) in this study. The permeation ratio plateaued at 10 h when the outer compartment (acceptor) of the membrane was agitated. In contrast, the permeation ratio was about 60% at 24 h and the paddle rotation speed did not affect the permeation rate when the inner compartment (donor) of the membrane was agitated. These results suggest that acceptor agitation was an important factor for accelerating the membrane permeation rate. In the absence of acceptor agitation, a certain period of time is needed for the acceptor to become homogenous. When the acceptor is inhomogeneous, the presence of a concentration gradient such that the tacrolimus concentration nearest to the dialysis membrane is highest likely means that the concentration difference across the membrane between the donor and acceptor is small. The notions that permeation through the membrane occurs by passive diffusion and that the permeation rate is predominantly correlated with the concentration difference as indicated in Fick’s law, might explain the low permeation rate in the absence of acceptor agitation.
In Vitro Release StudiesTo investigate the effect of dissolution methods on the dissolution ratio and profile and to identify a suitable dissolution approach which can predict in vivo release for tacrolimus microspheres, release tests were conducted using the paddle method without a dialysis membrane, paddle method with a dialysis membrane and external agitation, paddle method with a dialysis membrane and internal agitation, and the FTC method. The solubility of tacrolimus was first investigated as preparation for the release tests under sink conditions and the concentration of SLS in the release studies was determined based on the solubility test results (Table 2).
Table 2. Solubility of Tacrolimus in DPBS with or without SLS
| Dissolution medium | DPBS | DPBS + 0.1% SLS | DPBS + 0.3% SLS | DPBS + 0.5% SLS |
|---|
| Solubility of tacrolimus (µg/mL) | 1.1 | 102.9 | 300.7 | 360.7 |
Figure 4 shows the overall dissolution profiles of tacrolimus microspheres. Complete dissolution of TAD10 was accomplished using the paddle method without dialysis membrane (108.7 ± 0.8% at 28 d, Fig. 4(a)) and FTC method (103.8 ± 2.8% at 28 d, Fig. 4(d)). However, release was incomplete using the paddle method with a dialysis membrane and external agitation (82.0 ± 2.6% at 28 d, Fig. 4(b)). We hypothesize that the diffusion and/or erosion rate was reduced because there was no internal agitation and the donor compartment was not under sink conditions (18 mg of tacrolimus-loaded microspheres in 5 mL of DPBS with 0.1% SLS). In contrast, more than 90% dissolution was observed using the paddle method with a dialysis membrane and internal agitation (92.3 ± 13.4% at 28 d, Fig. 4(c)), indicating that the release rate was improved by donor agitation. For TAD21, the dissolution profile using the FTC method differed from that obtained using the other methods, and the dissolution rate was markedly accelerated after 14 d (29.1 ± 6.2% at 14 d and 104.5 ± 4.4% at 28 d, Fig. 4(d)). Samples were interposed by glass beads in the FTC method, which might have prevented the microspheres from aggregating. Aggregation is known to facilitate degradation of PLA/PGA to enable faster release if the release from microspheres is governed by the erosion process.32) Our present results, however, were not consistent with this previous report. While the mechanism has not been elucidated, the increase in effective surface area for dissolution caused by the lack of aggregation might have been a contributor.
The release rate from TAD10 was faster than that from TAD21 in all dissolution methods (Fig. 4). These results are consistent with the theory that a PLA/PGA ratio of 50 : 50 shows the fastest release, while a lower molecular weight of PLA/PGA shows faster release than a larger molecular weight of PLA/PGA.3,28,29)
Figure 5 shows the dissolution profiles of tacrolimus microspheres in the early phase (up to 1 d). Release of tacrolimus from the microspheres was detected even at the 1-hour sampling point (0.0417 d) using the paddle method without a dialysis membrane (Fig. 5(a)) and the FTC method (Fig. 5(d)). In contrast, tacrolimus was not detected using the paddle method with a dialysis membrane and external agitation until the 6-h sampling point (0.25 d) (Fig. 5(b)), or using the paddle method with a dialysis membrane and internal agitation until the 3-h sampling point (0.125 d) (Fig. 5(c)). Although inside agitation does not have the capacity to accelerate permeation rate, as shown in Fig. 3, it is considered that the release rate from the tacrolimus-loaded microspheres and/or solubility rate of tacrolimus in the dialysis membrane is enhanced by internal agitation.
In Vivo PK StudiesBlood concentration profiles of tacrolimus in rats when two different formulations of tacrolimus microspheres were administered subcutaneously at the dose of 7.5 mg/kg as tacrolimus are shown in Fig. 6. Both types of tacrolimus-loaded microspheres (TAD10 and TAD21) showed an initial burst which was subsequently followed by sustained release. TAD10 showed faster release than TAD21, with TAD10 and TAD21 exhibiting sustained release for 6 weeks and more than 9 weeks, respectively. The finding that TAD10 showed faster release than TAD21 is consistent with results observed in an in vitro release study (Fig. 4).
IVIVCFraction absorbed (Fabs) of tacrolimus from microspheres were calculated using a deconvolution method with the observed PK data (Fig. 6) and intravenous PK. A Weibull equation was fitted to each in vitro dissolution profile to obtain continuous dissolution curves (Diss (Tscale × Tvivo), which means Fdiss). Levy plots (Fabs vs. Fdiss) were generated with Eq. 1 using the WinNonlin 7.0 IVIVC Toolkit (Fig. 7) and the scale factors (Absscale and Tscale) and AIC were also calculated using the software with both TAD10 and TAD21 data. The results of IVIVC analysis are shown in Table 3. In the paddle method with dialysis membrane and internal agitation, the plots for both formulations were close to the 1 : 1 correlation line and this dissolution approach produced the smallest AIC values among the 4 types of dissolution method tested, indicating that the method could predict in vivo behavior of tacrolimus microspheres. Moreover, the Absscale value for this method was 1.11, which is close to 1, and the Tscale was 0.47, indicating that the period of the in vitro test method can be completed in about half the time of the in vivo study. We speculate that the paddle method with dialysis membrane and internal agitation produced the smallest AIC because microspheres administered subcutaneously or intramuscularly are retained at the administration site, where they are surrounded by tissue layers which make slow drug diffusion due to non-sink conditions.21,22) This indicates that the rate limiting step in the in vivo performance of microspheres cannot always correspond to drug release from the microspheres. A non-sink compartment in an in vitro dissolution method can be formed using a dialysis membrane. Dissolved tacrolimus transfers from inside to outside across the membrane. The dialysis membrane can therefore mimic drug behavior in the in vivo setting from administration site to circulating blood. Based on IVIVC evaluation, internal agitation is also an important factor for improving in vivo predictability.
Table 3. Parameters of IVIVC Models of the Paddle Method without a Dialysis Membrane, Paddle Method with a Dialysis Membrane and External Agitation Paddle Method with a Dialysis Membrane and Internal Agitation and the FTC Method
| Test method | Absscale | Tscale | AIC |
|---|
| Paddle method without dialysis membrane | 0.96 | 0.54 | −65 |
| Paddle method with dialysis membrane and external agitation | 1.53 | 0.36 | 185 |
| Paddle method with dialysis membrane and internal agitation | 1.11 | 0.47 | −90 |
| FTC method | 1.21 | 0.36 | 164 |
In addition, the dissolution profile can be flexibly changed by modulating the properties of the dialysis membrane, such as the MWCO, the material of the membrane, and the volume of membrane. This indicates that this dissolution test method may be similarly effective for other microsphere formulations and animal species.
Regarding initial burst absorption, the PK profile results in Fig. 6 show that this occurred within day 1. Absorption rates in the initial burst phase and in the subsequent phase after the initial burst distinctly differ. We therefore propose that the initial burst should be evaluated separately. The Tmax of TAD10 and TAD21 was observed at 1 and 3 h, respectively, and the Cmax of TAD10 was higher than that of TAD21. The fraction absorbed of TAD10 and TAD21 in day 1 was estimated to be 3.2 and 2.3%, respectively. These absorption ratios mean that establishing a quantitative in vitro dissolution test method with less error in microspheres remains challenging due to the low amount of fraction absorbed during day 1. Blood concentrations of tacrolimus were detected at 1 h after administration of TAD10 and TAD21. Paddle methods with a dialysis membrane are not suitable for in vitro dissolution testing aimed at reflecting in vivo absorption because tacrolimus was not detected in the dissolution medium until at least 3 h after initiation of the dissolution test (Figs. 5(b), (c)). It was considered that it took a certain time for tacrolimus to dissolve from microsphere and the pass through a dialysis membrane in the early phase of the dissolution testing. In the FTC method, the dissolution ratio of tacrolimus in TAD21 was higher than that in TAD10 at 1 h (Fig. 5(d)), which was inconsistent with the pharmacokinetics data. It would be difficult to detect precisely the difference of dissolution rate at 1 h in the FTC method because of highly variable value in TAD21. In the paddle method, dissolution ratios of tacrolimus in TAD10 and TAD21 at 1 d were 5.4 and 2.2%, respectively. Further, dissolution of tacrolimus from microspheres could be detected in the early phase with less variability in TAD10 and TAD21 and TAD10 showed higher dissolution profiles during day 1 than TAD21. These results suggest that the paddle method can qualitatively describe in vivo absorption for the initial burst part of microsphere dosing, and should be useful in comparing formulations with different dissolution rates in relation to the initial burst (Fig. 8).
Conclusion
A new dissolution method for evaluating tacrolimus release from microspheres was developed by rotating a customized paddle inside a dialysis membrane using the conventional paddle method. We conclude that the paddle method with dialysis membrane and internal agitation, which was designed to mimic in vivo conditions, could successfully predict overall PK profiles of tacrolimus microspheres. However, because no single method was effective in evaluating both the initial burst and overall PK profiles, we recommend that the initial burst be evaluated separately. By doing so, we were able to determine that the paddle method could predict the initial burst.
In conclusion, we propose that combination of the paddle method with a dialysis membrane and internal agitation to evaluate overall PK profiles, and the paddle method to describe the in vivo initial burst, represents a novel approach to in vitro dissolution evaluation for microsphere formulations.
Acknowledgment
The authors thank the members of Analytical Research Labs., Astellas Pharma Inc. for their support.
Conflict of Interest
The authors declare no conflict of interest.
References
- 1) Schneider A. K., Polylactide Sutures, U.S. Patent, 3,636,956 (1970).
- 2) Kulkarni R. K., Moore E. G., Hegyeli A. F., Leonard F., J. Biomed. Mater. Res., 5, 169–181 (1971).
- 3) Hahn J., Biopharmaceuticals–challenges and opportunities facing the drug-delivery industry, Touch Briefings, 114–118 (2009).
- 4) Miller R. A., Brady J. M., Cutright D. E., J. Biomed. Mater. Res., 11, 711–719 (1977).
- 5) Varde N. K., Pack D. W., Expert Opin. Biol. Ther., 4, 35–51 (2004).
- 6) Schreiber S. L., Crabtree G. R., Immunol. Today, 13, 136–142 (1992).
- 7) Ishibashi M., Yoshida K., Ozono S., Hirao Y., Takahashi K., Kawamura Y., Ohara K., Transplant. Proc., 33, 559–560 (2001).
- 8) Meçule A., Poli L., Nofroni I., Bachetoni A., Tinti F., Umbro I., Barile M., Berloco P. B., Mitterhofer A. P., Transplant. Proc., 42, 1317–1319 (2010).
- 9) Kuypers D. R. J., Peeters P. C., Sennesael J. J., Kianda M. N., Vrijens B., Kristanto P., Dobbels F., Vanrenterghem Y., Kanaan N., ADMIRAD Study Team, Transplantation, 95, 333–340 (2013).
- 10) FDA guidance for industry extended release oral dosage forms: development, evaluation, and application of in vitro–in vivo correlations, U.S. Department of Human Health and Human Services, Food and Drug Administration, 1997.
- 11) Shen J., Burgess D. J., J. Control. Release, 219, 644–651 (2015).
- 12) D’Souza S., Faraj J. A., Giovagnoli S., Deluca P. P., Int. J. Biomater., 2014, 407065 (2014).
- 13) Shen J., Choi S., Qu W., Wang Y., Burgess D. J., J. Control. Release, 218, 2–12 (2015).
- 14) D’Souza S. S., Faraj J. A., DeLuca P. P., AAPS PharmSciTech, 6, E553–E564 (2005).
- 15) Chu D. F., Fu X. Q., Liu W. H., Liu K., Li Y. X., Int. J. Pharm., 325, 116–123 (2006).
- 16) Rawat A., Bhardwaj U., Burgess D. J., Int. J. Pharm., 434, 115–121 (2012).
- 17) D’Souza S., Faraj J. A., Giovagnoli S., Deluca P. P., Prog. Biomater., 3, 131–142 (2014).
- 18) Zolnik B. S., Burgess D. J., J. Control. Release, 127, 137–145 (2008).
- 19) Blanco-Príeto M. J., Campanero M. A., Besseghir K., Heimgatner F., Gander B., J. Control. Release, 96, 437–448 (2004).
- 20) Vysloužil J., Doležel P., Kejdušová M., Mašková E., Mašek J., Lukáč R., Košťál V., Vetchý D., Dvořáčková K., Acta Pharm., 64, 403–417 (2014).
- 21) D’Souza S. S., DeLuca P. P., AAPS PharmSciTech, 6, E323–E328 (2005).
- 22) Kostanski J. W., DeLuca P. P., AAPS PharmSciTech, 1, 30–40 (2000).
- 23) Janas C., Mast M.-P., Kirsamer L., Angioni C., Gao F., Mäntele W., Dressman J., Wacker M. G., Eur. J. Pharm. Biopharm., 115, 73–83 (2017).
- 24) Kojima R., Yoshida T., Tasaki H., Umejima H., Maeda M., Higashi Y., Watanabe S., Oku N., Int. J. Pharm., 492, 20–27 (2015).
- 25) Langenbucher F., J. Pharm. Pharmacol., 24, 979–981 (1972).
- 26) Levy G., Leonards J. R., Procknal J. A., J. Pharm. Sci., 54, 1719–1722 (1965).
- 27) Akaike H., “Information theory and an extension of maximum likelihood principle,” ed. by Petrov B.N., Csaki F., Second International Symposium on Information Theory, Akademiai Kiado, Budapest, 1973, pp. 267–281.
- 28) Park T. G., Lu W., Crotts G., J. Control. Release, 33, 211–222 (1995).
- 29) Mittal G., Sahana D. K., Bhardwaj V., Ravi Kumar M. N., J. Control. Release, 119, 77–85 (2007).
- 30) Yuan W., Kuai R., Dai Z., Yuan Y., Zheng N., Jiang W., Noble C., Hayes M., Szoka F. C., Schwendeman A., AAPS J., 19, 150–160 (2017).
- 31) Xie L., Beyer S., Vogel V., Wacker M. G., Mäntele W., Int. J. Pharm., 488, 108–119 (2015).
- 32) Sansdrap P., Moës A. J., J. Control. Release, 43, 47–58 (1997).